Short answer: to study statistics, spend most of your time choosing and running the right method on new problems, not rereading formulas. For each problem, ask what the question wants (describe, compare, or predict), what the data looks like (continuous or categorical, one group or two), then pick a technique and execute it. Keep a short card for each test that says when it applies. Reading the chapter feels productive, but exams mostly ask you to choose and justify a method under time pressure.
If you've ever known a formula cold and still picked the wrong test, that's normal. Statistics rewards recognition more than recall of algebra. This guide shows how to practice that skill, with a worked example and a sample week.
The Quick Version
- Do problems, don't just read. Cover the solution and try first.
- Name the question type. Describe, compare groups, or predict a relationship.
- Use a decision path. Data type and number of groups narrow the test list fast.
- Write a "when does this apply?" card for every test and formula.
- Mix topics in one practice set so you practice choosing, not just computing.
- Explain the result in one sentence in plain English after every calculation.
Why Statistics Feels Different From Other Math
In algebra, the path is often clear once you see the equation. In statistics, half the work is deciding which tool fits. The University of Queensland's statistics support pages put it plainly: you need to practice choosing which formula or test a set of data requires, not only doing the arithmetic.
UBC Statistics gives the same advice in different words: get out a pencil, work every example step by step, and learn the vocabulary precisely. If you cannot write the definition of a p-value or a confidence interval without looking, applying the test later will feel like guessing.
So your study plan has two jobs. First, build a decision habit for picking methods. Second, get fluent at running and explaining those methods on fresh problems.
Step 1: Sort Problems by Question Type, Not by Chapter Title
Before you reach for a formula, write one line: what is this problem asking me to do?
| Question type | Typical wording | Common tools |
|---|---|---|
| Describe one variable | mean, median, spread, shape | summary stats, histograms, boxplots |
| Compare groups | is there a difference between... | t-test, ANOVA, chi-square |
| Relate two variables | association, correlation, predict | correlation, regression |
| Count categories | are these frequencies independent? | chi-square goodness of fit or independence |
Chapter titles in a textbook often mix these. If you sort by "Chapter 8 problems," you never practice the hardest exam skill: opening a new problem with no chapter label and deciding what it is. Mix problems from different chapters in one session so you train that choice.
Step 2: Use a Three-Move Routine (Select, Execute, Explain)
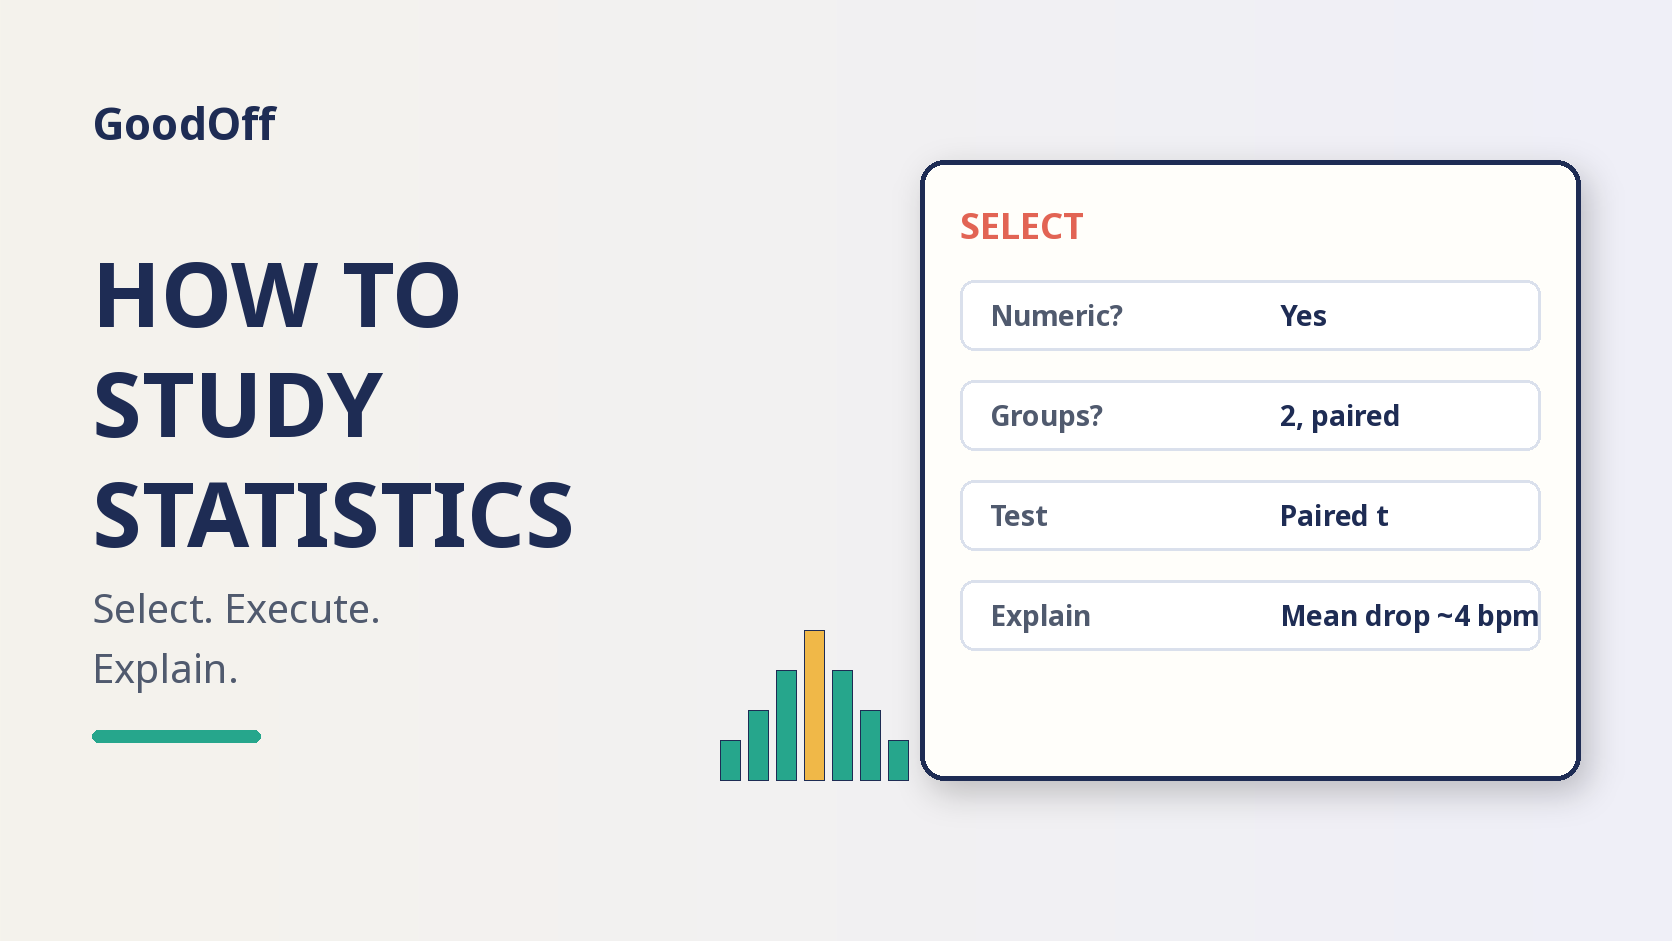
Queensborough Community College's tutoring tip sheet frames every statistics exercise as SEE: Select the technique, Execute it correctly, Explain the result. That matches what exams grade.
- Select. Name the question type, the data type (numeric or categorical), and the number of groups or variables. Write the test name before you compute anything.
- Execute. Check assumptions briefly (independence, sample size, normality or expected counts). Then run the calculation with symbols first when you can, numbers last.
- Explain. In one or two sentences, say what the result means for the original question. "We reject the null" is not enough. "There is evidence the mean reaction time differs between the two conditions" is better.
If you stop after Execute, you will lose points on written exams and you will not remember the method next week. The explanation is part of the practice.
Step 3: Worked Example (t-Test Decision)
Problem: A class measures resting heart rate for 18 students before and after a two-week walking plan. They want to know whether mean heart rate changed. What test, and what do you write first?
Select. Question type: compare. Data: numeric heart rate. Design: same people measured twice, so paired, not two independent samples. Test: paired t-test (or Wilcoxon signed-rank if the differences look badly skewed and the sample is small).
Execute (sketch). Compute each student's difference (after minus before). Mean difference = -4.2 bpm, SE = 1.5, t = -4.2 / 1.5 = -2.8, df = 17. Two-sided p is small (under 0.05 in a typical table).
Explain. "There is evidence that mean resting heart rate dropped after the walking plan (paired t, t(17) = -2.8, p < 0.05). The estimated drop is about 4 bpm."
Notice what you practiced: the choice of paired vs independent, not only the arithmetic. On an exam, that choice is often worth as much as the calculation.
Step 4: Build "When Does This Apply?" Cards
A formula card that only shows the equation is weak. Add a front that forces a decision.
| Front | Back |
|---|---|
| When do I use a two-sample t-test? | Compare means of one numeric variable across two independent groups; check roughly normal or large n. |
| When do I use chi-square independence? | Two categorical variables in a table; ask if the row variable is related to the column variable. |
| What does a 95% CI for a mean mean? | In repeated samples, about 95% of such intervals would contain the true mean; it is not "95% chance this sample mean is correct." |
| Paired vs two-sample? | Paired if the same unit is measured twice or matched; two-sample if unrelated groups. |
Quiz yourself on the front. If you can only recite the formula from the back, flip the card design. Practice testing ranks high in Dunlosky and colleagues' 2013 review of learning techniques, and it fits statistics especially well because the hard part is choosing under uncertainty.
Step 5: Mix Practice Sets (Interleaving)
Blocked practice looks like: twenty t-tests, then twenty chi-squares. Interleaved practice looks like: a shuffled set where you must pick the method each time. McGill's student learning resources use statistics as the example for interleaving: alternate regression problems, experiment-type cards, and chi-square sets in one session.
Interleaving feels harder. That is a feature. The difficulty of choosing is the skill you need on the exam. For a related guide on mixing topics, see interleaving practice.
A Sample Week for an Intro Stats Course
| Day | Focus (45-75 min) |
|---|---|
| Mon | New lecture: write 5 "when does this apply?" cards; do 4 textbook examples with solutions covered. |
| Tue | Mixed set: 8 problems from last two chapters; mark every Select mistake. |
| Wed | Concept day: explain mean vs median, p-value, and CI out loud in plain English (Feynman-style). |
| Thu | Software or calculator fluency: rerun 3 problems you already understand; check you get the same decision. |
| Fri | Short mixed quiz (10 items); rewrite cards for anything you missed. |
| Weekend | One longer mixed set; turn weak spots into a mini study guide page. |
If you also want a template for pulling a chapter into one page, see how to make a study guide. For problem-heavy STEM classes next door to stats, how to study for a math test and how to study physics use the same "struggle first, then check" habit.
Step 6: Learn to Read Output, Not Just Punch Buttons
Many courses grade software output. Treat a printout the same way you treat a hand calculation: find the test name, the estimate, the uncertainty, and the decision.
- Find the effect. Mean difference, odds ratio, slope, or proportion. Write it with units.
- Find the uncertainty. Standard error, confidence interval, or both.
- Find the decision stats. Test statistic, degrees of freedom if shown, and p-value.
- Check the design still matches. If the software ran an independent t-test on paired data, the number is wrong even if the p-value looks tidy.
A useful drill: take one homework solution, hide the interpretation paragraph, and rewrite it from the numbers alone. Then compare. That drill builds the Explain step without needing new data.
Assumptions Without the Panic
You do not need to become a theorist. You need a short checklist you actually use.
| Method | Quick checks |
|---|---|
| One or two-sample t | Independent observations; roughly symmetric or large n; for two-sample, similar spreads or use Welch. |
| Paired t | Paired design; differences roughly symmetric or large n. |
| ANOVA | Independent groups; similar spreads; residuals not wildly skewed. |
| Chi-square | Counts, not percentages; expected counts mostly at least 5. |
| Simple regression | Linear pattern in scatter; residuals without strong curves; outliers noted. |
If an assumption looks broken, write that in your Select step and name the backup method your course taught (Welch, nonparametric, transform, or "report with caution"). Instructors reward that honesty more than a silent wrong default.
Common Mistakes
- Memorizing formulas without conditions. A t formula without "independent groups vs paired" is half a tool.
- Ignoring data type. Running a mean comparison on categorical codes without thinking is a classic trap.
- Stopping at the p-value. Always answer the original question in context and units.
- Only practicing inside one chapter. Exams do not print the chapter number on each item.
- Skipping assumptions. You do not need a dissertation, but you should notice tiny expected counts or clearly paired data.
How GoodOff Fits a Statistics Study Plan
After you understand a method, you still need retrieval practice on "when do I use this?" and on definitions. GoodOff can turn your lecture PDF or notes into editable flashcards and auto-graded quizzes with explanations (multiple-choice and open-ended). Free and Pro both include quiz generation, with higher limits on Pro. Generated cards can contain errors, so edit anything that looks off before you trust it for an exam. Sage, GoodOff's source-grounded AI tutor, is on Pro and can quiz you from your uploaded notes when you want a spoken or written explanation loop.
Use GoodOff for the card and quiz loop. Keep your pencil for the Select-Execute-Explain work on new problems. That split matches how statistics is actually graded.
Frequently Asked Questions
How many practice problems should I do for statistics? Quality beats raw count. Aim for mixed sets where you must choose the method. Eight carefully chosen mixed problems beat twenty from the same section.
Should I memorize every formula? Memorize the decision conditions and what each symbol means. Many courses allow a formula sheet; they still expect you to pick the right line on that sheet.
What if I freeze when choosing a test? Write the question type and data type first. That alone removes most options. Then name one test and defend it in a sentence before you calculate.
Is rereading the textbook useful? Use it to fill a specific gap after a failed attempt. Rereading whole chapters without problems ranks poorly compared with practice testing in Dunlosky et al. 2013.
How do I study for a stats software exam (R, SPSS, Excel)? Practice the same decisions, then rehearse the clicks or code on problems you already solved by hand. Software fluency without method choice still fails written parts.
Bottom Line
Statistics is a choosing sport. Train the choice with mixed problems, keep "when does this apply?" cards, and always explain the result in plain English. Do that consistently and the formulas stop feeling like a pile of disconnected tricks.
Ready to practice the decision cards? Upload your stats notes or PDF and generate a quiz you can edit. Try GoodOff free.