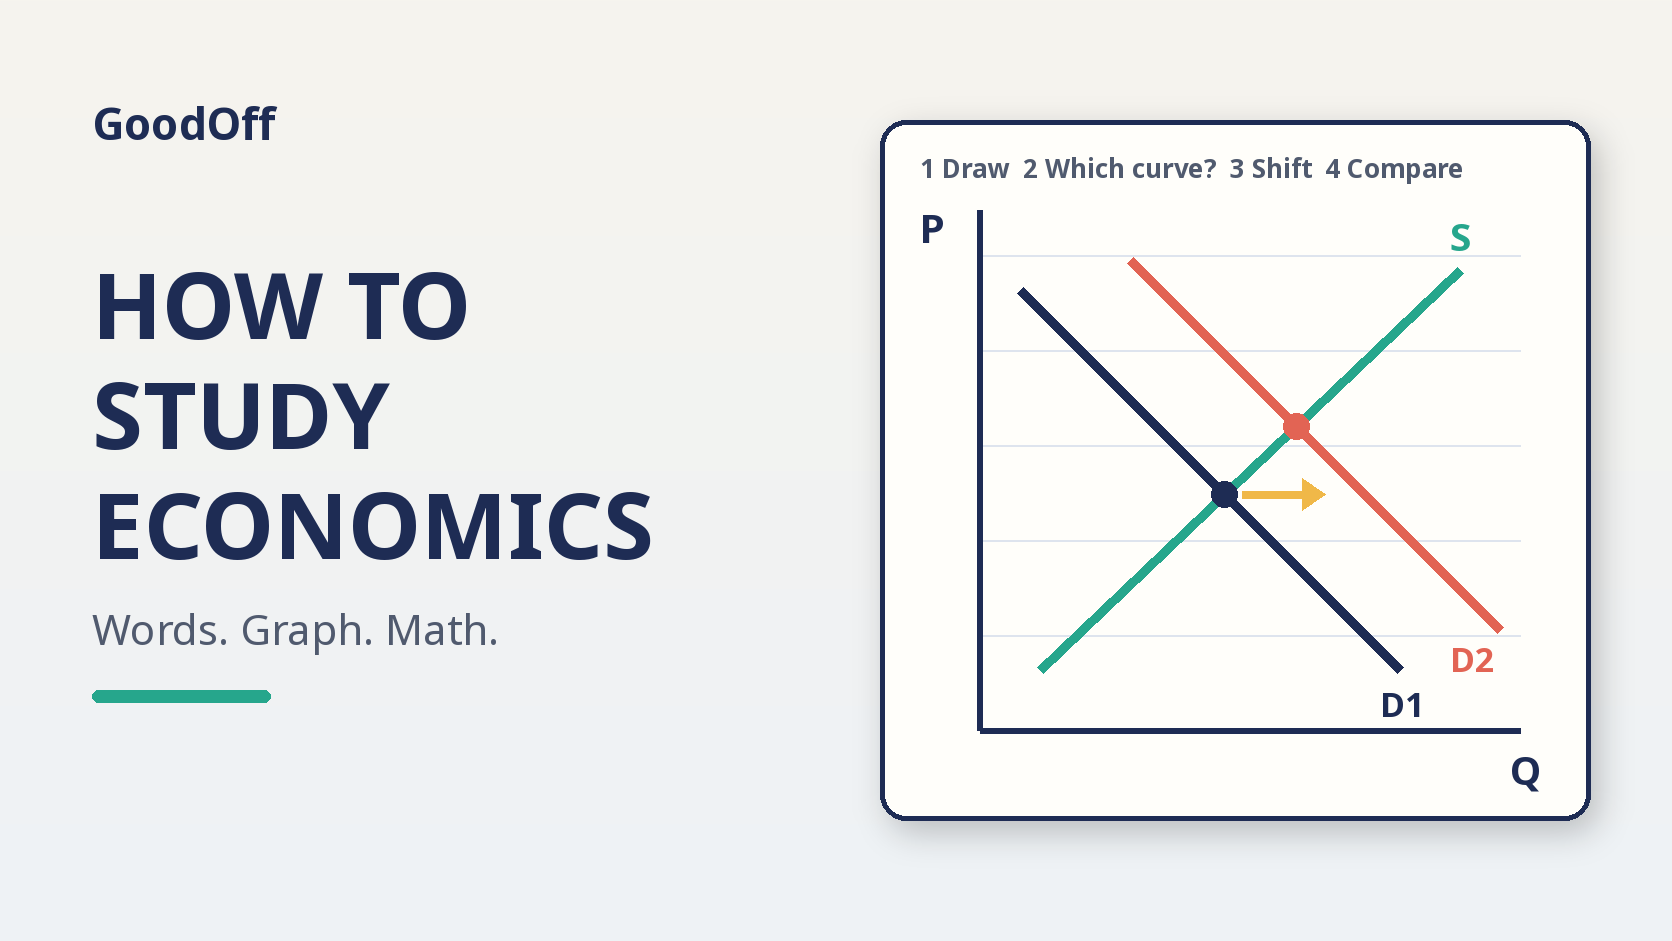
Short answer: to study economics, learn every model in three forms: a sentence, a graph you can draw from a blank page, and the simple math behind it. Then practice by working problems, not by rereading. For any "what happens if" question, use the same four steps: draw the starting model, decide which curve the event moves, shift it in the right direction, and compare the old and new outcome. Most economics exams test whether you can run that reasoning on a scenario you have not seen before.
Economics trips people up because it looks like a reading subject and is graded like a problem-solving subject. You can follow every lecture slide and still freeze when a question says "a frost hits the coffee harvest while a new study says coffee is healthy. What happens to price and quantity?" This guide shows how to study for that kind of question, with a worked example and a weekly routine.
The Quick Version
- Learn each model three ways: words, graph, and math. If one mode is weak, the other two can't cover for it on an exam.
- Redraw graphs from memory. Label both axes, every curve, and the equilibrium before you look at the textbook figure.
- Use the four-step shift method for every scenario question.
- Keep a "which curve moves?" list of the events that shift demand, shift supply, or only move along a curve.
- Sort practice problems by type and then mix the types so you practice choosing the model.
- Explain the result in one sentence with a cause and an effect after every answer.
Why Economics Is Harder Than It Looks
Intro economics has a small vocabulary and a handful of core models: supply and demand, elasticity, costs and market structures, and in macro, aggregate demand and supply plus money and the business cycle. The ideas are short. The difficulty is applying them correctly when the question is wrapped in a story.
The Amherst College economics department's study advice puts it simply: economic ideas can be understood mathematically, intuitively, or graphically, and you should build all three. It also tells students to try reproducing figures from scratch, because a graph can seem obvious while you read and then become confusing when you try to explain it. That gap between "I recognize this" and "I can produce this" is where most lost points come from.
Learn Each Model in Three Modes
For every model your course covers, make one page (or one card set) with three parts.
| Mode | What you write | Example: market for coffee |
|---|---|---|
| Words | One or two sentences on what the model says and what moves it | Price adjusts until the amount buyers want equals the amount sellers offer. Tastes, income, and related prices move demand; input costs and technology move supply. |
| Graph | The diagram drawn by hand, fully labeled | Price on the vertical axis, quantity on the horizontal, downward demand, upward supply, equilibrium marked on both axes. |
| Math | The equations or calculation the course expects | Qd = 100 - 2P and Qs = 20 + 2P give P = 20 and Q = 60. |
Test yourself by covering two columns and producing them from the third. If you can draw the graph but can't say in words why the curve slopes down, that is your study task for the day.
The Four-Step Shift Method
Many principles textbooks, including the OpenStax Principles of Microeconomics text used by many colleges, teach a four-step process for changes in equilibrium. Use it every time, even when the answer feels obvious:
- Step 1: Draw the starting model. Axes, curves, and the original equilibrium price and quantity.
- Step 2: Decide which curve the event affects. Is it something about buyers (demand) or sellers (supply)?
- Step 3: Decide the direction and draw the new curve. Does the event make buyers want more or less at each price, or make sellers offer more or less?
- Step 4: Compare old and new equilibrium. State what happened to price and to quantity.
The habit matters more than the speed. Students who skip Step 2 often shift the wrong curve, and a price change itself never shifts its own market's demand or supply curve. It only moves you along the curves.
Worked Example: Two Shocks at Once
Question: A frost destroys part of a major coffee harvest. In the same month, a widely shared study says coffee is good for your health. What happens to the price and quantity of coffee?
Step 1. Draw supply and demand for coffee with the starting equilibrium P1, Q1.
Step 2. The frost affects sellers, so it moves supply. The health study affects buyers' tastes, so it moves demand. Two curves move.
Step 3. Supply shifts left (less coffee offered at every price). Demand shifts right (more coffee wanted at every price).
Step 4. Both shifts push price up, so price rises for sure. For quantity, the supply shift pushes it down and the demand shift pushes it up. Without knowing which shift is bigger, the change in quantity is ambiguous.
One-sentence explanation: "The frost cuts supply and the study raises demand, so price rises, but quantity could go either way depending on which shift is larger."
Now check the math version with simple numbers. Start with Qd = 100 - 2P and Qs = 20 + 2P, so P = 20 and Q = 60. If only demand rises to Qd = 120 - 2P, set 120 - 2P = 20 + 2P, which gives P = 25 and Q = 70. Price and quantity both rise, which matches the graph for a demand increase. Running the math and the graph side by side is how you catch a sign error before the exam does.
Build a "Which Curve Moves?" List
A short list of shifters saves more points than another pass through the chapter. Keep it on one page and quiz yourself on it.
| Event | What moves | Direction |
|---|---|---|
| Income rises, normal good | Demand | Right |
| Price of a substitute rises | Demand | Right |
| Price of a complement rises | Demand | Left |
| Input costs rise | Supply | Left |
| Better production technology | Supply | Right |
| The good's own price changes | Neither curve | Movement along the curves |
Do the same for macro: list what shifts aggregate demand, what shifts short-run aggregate supply, and what a central bank tool does in your course's model.
Read Graphs Like a Story
Cornell's study tips for economics courses suggest asking what "economic story" each graph tells, what it assumes, what units sit on each axis, and whether the relationship is positive or negative. That turns a picture into something you can explain.
- Before you draw: name the model (competitive market, monopoly, labor market, AD-AS).
- While you draw: label axes with the real variables, not just "x" and "y". Use subscripts for old and new curves.
- After you draw: mark the answer on the axes and write one sentence that tells the story in order: cause, curve, outcome.
Stanford's Center for Teaching and Learning gives Econ 1 students similar advice: sketch each diagram in your own hand while reading, and work numerical examples yourself instead of only following the solution.
Practice Problems the Right Way
Problem sets are where economics is learned. Watching a TA solve a problem feels clear, but the only proof is solving a similar one alone.
- Try first, then check. Cover the solution and give each problem a real attempt.
- Label the problem type in the margin: shift question, elasticity calculation, cost curves, welfare area, policy (tax, price ceiling, subsidy).
- Mix types once you know them. A set of eight mixed problems trains you to pick the model, which is what the exam asks. Our guide to interleaving practice explains why mixing helps.
- Keep an error log. Write what you got wrong and which step failed: wrong curve, wrong direction, math slip, or no explanation.
- Redo returned work. Amherst's advice is to go through returned assignments with the solutions and note suggestions for your future work.
If your course uses regression or data later on, the habits in how to study statistics carry over directly.
A Sample Week Before an Economics Exam
| Day | Focus | Task |
|---|---|---|
| 1 | Inventory | List every model on the syllabus. Fill in the words, graph, and math page for each one from memory, then check. |
| 2 | Shifters | Quiz yourself on the "which curve moves?" list. Do six single-shock scenario questions with the four-step method. |
| 3 | Calculations | Elasticity, equilibrium with equations, and surplus or deadweight loss areas. Show every step. |
| 4 | Mixed set | A timed set mixing all problem types, including two-shock questions. Log every error. |
| 5 | Written answers | Practice short explanations and one longer policy question. See how to study for an essay exam for outlining under time. |
| 6 | Practice exam | Take a past exam or instructor practice test under timed conditions. Grade it honestly. |
| 7 | Fix and rest | Redo only the questions you missed, review your error log, and sleep. |
Common Mistakes
- Shifting a curve because the good's own price changed. That is a movement along the curve.
- Memorizing graphs as pictures. If you can't say why each curve slopes the way it does, you'll misdraw it under pressure.
- Answering only "price goes up." Exams usually want price and quantity, plus the reason.
- Calling an ambiguous result certain. When two shifts push quantity in opposite directions, say so.
- Reading the chapter instead of doing problems. Use the textbook to fix a specific gap after a failed attempt. Our guide on reading a textbook so you remember it shows how to read with questions.
How GoodOff Fits an Economics Study Plan
The drawing and the four-step reasoning are pencil work. The definitions, shifters, and "when does this apply?" facts are where retrieval practice helps. GoodOff can turn your lecture slides, notes, or a PDF chapter into editable flashcards that are scheduled with FSRS spaced repetition, and into auto-graded quizzes with multiple-choice and open-ended questions and an explanation for each answer. Quizzes are included on both the Free and Pro plans, with higher limits on Pro. Generated cards can contain mistakes, so check them against your course material and edit anything that is off.
On Pro, Sage, GoodOff's AI tutor, answers questions from your uploaded source and cites the passages it used. You can also send it a photo of a diagram you drew and ask it to explain what the graph shows, then compare that with your own one-sentence explanation.
Frequently Asked Questions
Is economics more math or more reading?
Intro courses use mostly algebra and graphs, plus written explanations. Upper-level courses add calculus and statistics. In every case, being able to explain the reasoning in words is graded as much as the calculation.
How do I memorize economics graphs?
Don't memorize them as images. Learn why each curve slopes the way it does, then redraw the graph from a blank page with full labels until you can do it without checking. Each correct redraw is a recall test.
How should I study for a microeconomics exam versus a macroeconomics exam?
The method is the same: three modes, the shift steps, mixed problems. Micro leans on markets, elasticity, costs, and market structures. Macro leans on aggregate demand and supply, money, and policy tools, so your shifter list should focus on those.
What if I always shift the wrong curve?
Slow down at Step 2. Ask "does this event change buyers or sellers?" and write the answer before drawing anything. Then drill your shifter list until each event gets an instant answer.
How many practice problems should I do?
Enough that every problem type on the syllabus has been solved correctly at least twice without help, including in a mixed set. Quality and variety matter more than a raw count.
Bottom Line
Studying economics well means learning each model in words, graphs, and math, and then using it on new scenarios. Use the four-step shift method every time, keep a shifter list, mix your practice problems, and end every answer with one clear sentence. That routine turns the course from a pile of graphs into a short set of tools you know how to use.
Ready to quiz yourself on the shifters? Upload your economics notes or slides and turn them into a quiz and cards you can edit. Try GoodOff free.